How do cosmologists deduce this pattern from the CMB? They plot the magnitude of the temperature variations against the sizes of the hot and cold spots in a graph called a power spectrum.
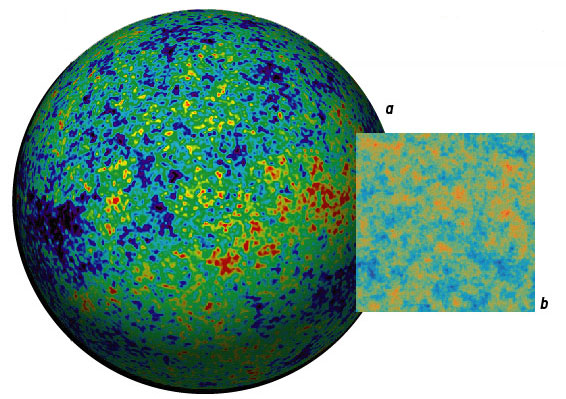
Temperature Maps: Observations of the CMB provide a map of temperature variations across the whole sky (a). When researchers analyze portions of that map (b), they use band filters to show how the temperature of the radiation varies at different scales.
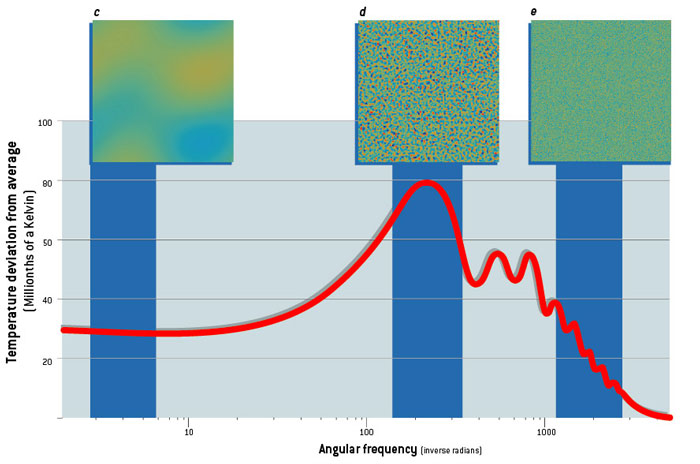
Power Spectrum: The variations are barely noticeable at large scales corresponding to regions that stretch about 30 degrees across the sky (c) and at small scales corresponding to regions about a tenth of a degree across (e). But the temperature differences are quite distinct for regions about one degree across (d). This first peak in the power spectrum (graph at bottom) reveals the compressions and rarefactions caused by the fundamental wave of the early universe; the subsequent peaks show the effects of the overtones.
Sound waves also oscillated in the plasma of the early universe. After inflation, the fundamental wave compressed some regions of plasma and rarefied others, causing the temperature of the CMB radiation in the regions to reach maximum (blue) and minimum (red) values by the time of recombination. The overtones oscillated two, three or more times as quickly, causing smaller regions to reach maximum and minimum CMB temperatures at the time of recombination. The results show that the regions with the greatest variations subtend about one degree across the sky, or nearly twice the size of the full moon. (At the time of recombination, these regions had diameters of about one million light-years, but because of the 1,000-fold expansion of the universe since then, each region now stretches nearly one billion light-years across.) This first and highest peak in the power spectrum is evidence of the fundamental wave, which compressed and rarefied the regions of plasma to the maximum extent at the time of recombination. The subsequent peaks in the power spectrum represent the temperature variations caused by the overtones. The series of peaks strongly supports the theory that inflation triggered all the sound waves at the same time. If the perturbations had been continuously generated over time, the power spectrum would not be so harmoniously ordered. To return to our pipe analogy, consider the cacophony that would result from blowing into a pipe that has holes drilled randomly along its length.
The theory of inflation also predicts that the sound waves should have nearly the same amplitude on all scales. The power spectrum, however, shows a sharp drop-off in the magnitude of temperature variations after the third peak. This discrepancy can be explained by the fact that sound waves with short wavelengths dissipate. Because sound is carried by the collisions of particles in gas or plasma, a wave cannot propagate if its wavelength is shorter than the typical distance traveled by particles between collisions. In air, this distance is a negligible 10-5 centimeter. But in the primordial plasma just before recombination, a particle would typically travel some 10,000 light-years before striking another. (The universe at this stage was dense only in comparison with the modern universe, which is about a billion times as rarefied.) As measured today, after its 1,000- fold expansion, that scale is about 10 million light-years. Therefore, the amplitudes of the peaks in the power spectrum are damped below about 10 times this scale.