The basic observable of the CMB is its intensity as a function of frequency
and direction on the sky ![]() . Since the CMB spectrum is an extremely good blackbody
[Fixsen et al, 1996] with a nearly constant
temperature across the sky T, we generally describe this observable in terms of a temperature fluctuation
. Since the CMB spectrum is an extremely good blackbody
[Fixsen et al, 1996] with a nearly constant
temperature across the sky T, we generally describe this observable in terms of a temperature fluctuation
![]() .
.
If these fluctuations are Gaussian, then the
multipole moments of the temperature field
are fully characterized by their power spectrum
whose values as a function of l
are independent in a given realization. For this reason predictions
and analyses are typically performed in harmonic space. On small sections of the
sky where its curvature can be neglected, the spherical harmonic analysis becomes
ordinary Fourier analysis in two dimensions. In this limit l
becomes the Fourier wavenumber. Since
the angular wavelength &theta=2&pi/l, large multipole moments corresponds to small angular
scales with l~102
representing degree scale separations. Likewise, since
in this limit the variance of the field is &int d2l
Cl/(2π)2, the power spectrum is usually displayed
as
the power per logarithmic interval in wavenumber for l>>1.
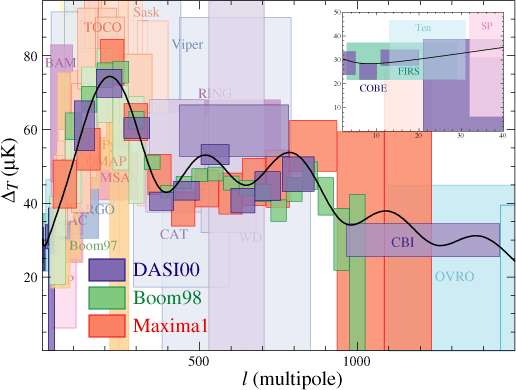
Plate 1 (top) shows observations of &DeltaT along with the prediction of the working cosmological model, complete with the acoustic peaks mentioned in §1 and discussed extensively in §3. While COBE first detected anisotropy on the largest scales (inset), observations in the last decade have pushed the frontier to smaller and smaller scales (left to right in the figure). The MAP satellite, launched in June 2001, will go out to l~1000, while the European satellite, Planck, scheduled for launch in 2007, will go a factor of two higher (see Plate 1 bottom).
The power spectra shown in Plate 1 all begin at l=2 and exhibit large errors at low multipoles. The reason is that the predicted power spectrum is the average power in the multipole moment l an observer would see in an ensemble of universes. However a real observer is limited to one Universe and one sky with its one set of &Thetalm, 2l+1 numbers for each l. This is particularly problematic for the monopole and dipole (l=0,1). If the monopole were larger in our vicinity than its average value, we would have no way of knowing it. Likewise for the dipole, we have no way of distinguishing a cosmological dipole from our own peculiar motion with respect to the CMB rest frame. Nonetheless, the monopole and dipole - which we will often call simply &Theta and v&gamma - are of the utmost significance in the early Universe. It is precisely the spatial and temporal variation of these quantities, especially the monopole, which determines the pattern of anisotropies we observe today. A distant observer sees spatial variations in the local temperature or monopole, at a distance given by the lookback time, as a fine-scale angular anisotropy. Similarly, local dipoles appear as a Doppler shifted temperature which is viewed analogously. In the jargon of the field, this simple projection is referred to as the freestreaming of power from the monopole and dipole to higher multipole moments.

|
|||||||||||||||||||||||||||||||||||||||||||||||||||||||||||||||||||||||||||||||||||||||||||||||||||||||||
How accurately can the spectra ultimately be measured? As alluded to above,
the fundamental limitation is set by ``cosmic variance''
the fact that there are only ![]()
![]() -samples of the power in each multipole moment. This leads to an inevitable
error of
-samples of the power in each multipole moment. This leads to an inevitable
error of
Allowing for further averaging over ![]() in bands of
in bands of ![]() , we see that the precision in the power spectrum
determination scales as
, we see that the precision in the power spectrum
determination scales as ![]() , i.e.
, i.e. ![]() at
at ![]() and
and ![]() at
at ![]() . It is the combination of precision predictions and prospects
for precision measurements that gives CMB anisotropies their unique stature.
. It is the combination of precision predictions and prospects
for precision measurements that gives CMB anisotropies their unique stature.
There are two general caveats to these scalings. The first is that any source
of noise, instrumental or astrophysical, increases the errors. If the noise
is also Gaussian and has a known power spectrum, one simply replaces the power
spectrum on the rhs of Equation (4) with
the sum of the signal and noise power spectra [Knox, 1995]. This is the reason that the errors
for the Planck satellite increase near its resolution scale in Plate 1
(bottom). Because astrophysical foregrounds are typically non-Gaussian it is
usually also necessary to remove heavily contaminated regions, e.g. the galaxy.
If the fraction of sky covered is ![]() , then the errors increase by a factor of
, then the errors increase by a factor of ![]() and the resulting variance is usually dubbed ``sample
variance'' [Scott et al, 1994]. An
and the resulting variance is usually dubbed ``sample
variance'' [Scott et al, 1994]. An